
Table of Contents
Developed by Google, Google Analytics is a free and advanced tool providing performance analysis of your website. This is where it’s useful. Data is power in the cutthroat digital landscape of today. Whether you run a small business, are a blogger, or are a marketer, your success on the internet depends on knowing how users interact with your website.
In this “beginner’s guide to understanding Google Analytics,” you will be guided through the principles, given an explanation of key metrics, and shown how to make sense of the data from your website in order to enhance your online strategy.
How Can I Get Knowledge About Google Analytics?
Built by Google, Google Analytics is a web analytics tool It monitors and records website traffic. It helps website owners grasp:
- Where people find your website
- What they do once they get at your site
- How long they stay on your site
- Which pages they return to most
- Whether or not your website is successful in achieving its objectives
Google Analytics uses a tracking code you insert on your website to compile this data. The platform starts instantly gathering real-time visitor activity when it is put in use.
Google Analytics: What Are the Benefits of Using It?

1. Decisions should be based on the available information.
The days of trying to find out what your audience wants are long past. By means of Google Analytics, you can get actual understanding of user behavior, therefore guiding your selections depending on real-time updated data.
2. Improve the general website performance.
You will be able to identify which pages users are bouncing off the site from and which are functioning really well. This tool helps you to maximize content, fix issues, and enhance the user experience.
3. Track Marketing Campaigns’ Situation
Google Analytics helps you to evaluate the effectiveness of your SEO campaigns, Facebook ads, and email marketing initiatives by showing the source of your traffic and therefore guiding your evaluation.
4. Define and assess your goals.
You can set objectives for your website using conversion monitoring—that is, the amount of individuals who register for your newsletter, make purchases, or submit forms—then assess how successfully your website is meeting those goals.
Configuring Google Analytics: The Process
Starting Google Analytics is not difficult in general. For newbies, the following is a basic setup:
1. Getting registered for a Google account comes first.
Utilizing Google Analytics requires you to have a free Google account. If you now use Gmail or any other Google service, you can make advantage of your current account.
2. Register for Google Analytics second step here.
Visit https://analyzes.google.com/ to register for Google Analytics. After clicking the “Start measuring” button, enter your account name, website name, and further preferences.
3. As the Third Step Add Your Website
Apart from choosing your sector of business and time zone, you will have to provide the URL of your website.
4. Getting the Tracking Code comes in at fourth.
You will receive a tracking ID or script after the configuring process ends. You should include this code on every single page of your website, ideally inside the head element.
5. Verifying the install comes in as the fifth stage.
The “Realtime” report in Google Analytics will let you confirm that the tracking code is working as expected. If you see yourself as a guest, you can regard the configuration as successful.
How to Guide Yourself Across the Dashboard of Google Analytics
Google Analytics’s dashboard could first seem frightening, but when split down into its component elements, it becomes far easier to understand. You will primarily use the following sections:
1. The House
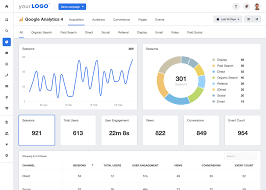
This overview covers a range of significant highlights including user count, sessions, bounce rate, and real-time activity.
2. Right now
Right now, see what is happening on your website. This category covers active users, top locations, top sites, and traffic sources.
3. Target population
Learn more about your users—including their demographics, country of origin, device of choice, browser used, and language spoken—including their
4. Assuming Ownership
This part shows the several ways guests are looking for your website: direct visits, paid searches, organic search, social media, referral links, etc.
5. Behavior Number Five
Once users reach your website, you will be able to look at the actions they do. You will be shown flow of user movement, pageviews, average time spent on page, bounce rates, and other measures.
6. Conversions (number six)
If you have set goals or are using e-commerce tracking, this section will inform you about how many people have achieved those objectives and where they came from.
An Interpretive Guide to Google Analytics’ Most Crucially Important Metrics
1. People who benefit from
This statistic will let you know overall how many distinct people visited your website within the designated period.
2. Sessions, second
In reference to your website, a session is one visit. Users that come back later on can have many sessions.
3. The Bouncing Rate
The click-through rate—also known as bounce rate—is the proportion of users of your website that leave after reading only one page. A high bounce rate may be caused by either poor content or usability problems.
4. The Usual Length of a Session Overall
This data helps one to estimate the average time viewers of your website spend.
5. Every Session’s Page Count
It displays the number of pages a user has visited during a single session. Larger page counts usually indicate that your users are likely more engaged.
6. Traffic Origin: Number Six
Consider your guests’ several backgrounds.
- Organic: from Google and other search engines
- Direct: obtained from the market. You used bookmarks or entered your URL
- Referral: from another website
- Social: from your personal network
- Paid: taken from many social media channels. Paid for campaigns with advertising
Google Analytics Goal-Setting: Setting Objectives
Establishing goals helps you to monitor user behavior relevant for your business. Among the illustrations are:
- Form filings
- Purchasing of products
- Video views
- Newsletter sign-up requests
A Handbook for Clarifying Your Goals
- First comes Admin > View > Goals.
- Click the “New Goal” button.
- Choose either a customized or a pre-made goal.
- Indicate the kind of goal you wish to reach (event, location, length of time, number of pages or screens every session).
- Set the values and save the changes.
Once the objectives have been set, you will be able to monitor conversion rates and notice how users perform important activities on your website.
Using Google Analytics’ Provided Reports to Improve Your Website
1. Maximize the Traffic Sources
Consult the Acquisition report to find which traffic sources have the best conversion rates. Keep your marketing initiatives focused on the regions most likely to yield success.
2. Improve Pages Having a High Bounce Rate
Consult the report under “Behavior > Site Content” to find pages with high bounce rates. Changing information, lowering load times, or bettering design will help to keep user involvement.
3. The Mobile Devices’ Responsiveness
The “Audience > Mobile” report offers details on the way your website works on several devices. Should the bounce rate of your mobile platform be high, you must enhance your website for mobile devices.
4. User Pipeline Analysis
Your website’s behavior flow serves as a visual guide for user movement. Use it to find drop-off sites and improve the site’s construction.
Advice for Those Starting Their Google Analytics Use
- Frequent login will help you to keep current on performance.
- You should use segments to divide several types of traffic, including new visitors from returning ones.
- Furthermore, you should create filters to prevent the results from including your IP address.
- To obtain more detailed SEO statistics, join with Google Search Console.
- To quickly access important indications, you can design “custom dashboards”; also, you can look at the “Google Analytics Academy” to get free training.
What Fresh Features of Google Analytics 4 (GA4) Offer?
Google has unveiled Google Analytics 4 (GA4) as the future iteration of analytics tool. This more recent form of Universal Analytics has replaced the previous one and also brings fresh approaches of data collecting and analysis.
General GA4 Attribute Characteristics
Among the noteworthy developments are:
- Improved cross-device monitoring
- Event-based tracking instead of session-based tracking
- Artificial intelligence-powered predictive insights
- More customizable reporting
- More strict data protection policies
GA4 is the new standard, hence even if it seems challenging at first, it is advisable to learn it.
Typical Mistakes Users of Google Analytics Should Strive Against
1. The First Issue is Improperly Installed the Tracking Code
Any missing or erroneous tracking code will prevent data collection. Ensure its installation is correct at all times.
2. Neglecting the Goal-Setting Mechanism
You have no goals hence it is impossible to track performance or conversions with accuracy.
3. Ignoring Mobile Data Included Into Account
Most customers of today use mobile browsing. Ignoring mobile reports could lead to missed chances for optimization.
4. Lack of Filtering
Filters help you to clean your data, filter internal traffic, and focus on exact results.
Some Last Words
Anyone running a website should definitely have a strong grasp of Google Analytics by 2025. In addition to helping you to make more wise decisions, it helps you to understand your audience in ways that would be challenging in any other situation.
You will first have to set it up; then, you will have to get acquainted with the key metrics; lastly, you will apply the insights to enhance your user experience, marketing, and content. Regarding increasing your online visibility, Google Analytics will finally turn into one of the most important instruments at your disposal.
Just starting out should you concentrate on doing one report at a time? Your analytics dashboard will eventually be comfortable and confident for you to explore, and you will be able to make decisions motivated by data, therefore enhancing your success.
Want to know about “How margins are adjustable in Google Docs.“